
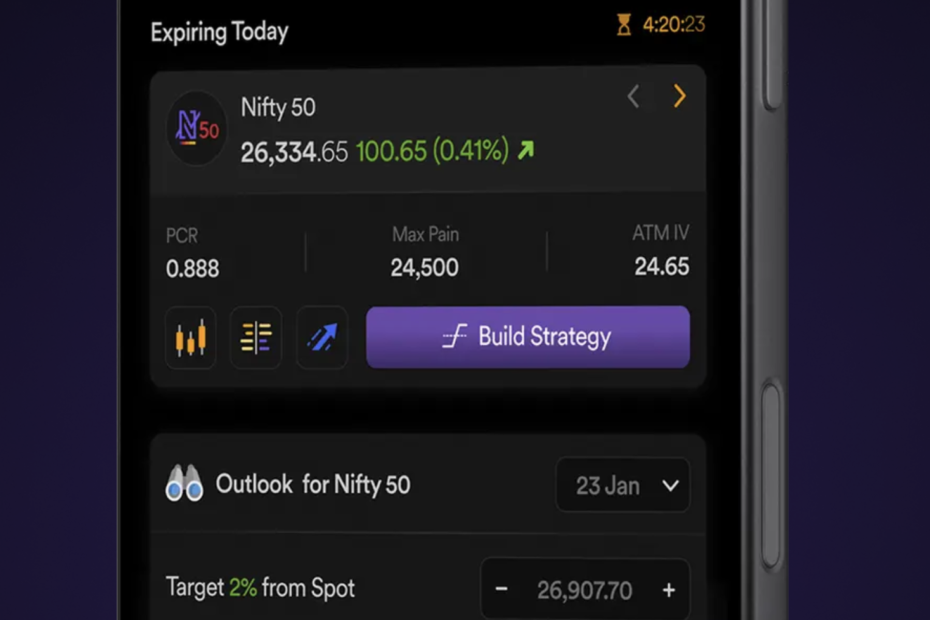
An option chain is often treated as a quick reference for checking premiums and selecting strike prices. However, it contains several other details that can help traders understand how positions are distributed across the market. From open interest and trading volume to implied volatility, each figure offers a different perspective on Nifty options activity.
Understanding these numbers can help you assess market activity before choosing a contract. The key is to read them together rather than treating any single figure as a signal to buy or sell. Let’s look at the important parts of the Nifty option chain and how to interpret them.
Start with the strike price
The strike price is the reference price at which an option contract gives its holder the right to buy or sell the underlying asset, subject to the contract terms.
In a Nifty option chain or Nifty 50 option chain, strike prices appear in the centre, with call options on one side and put options on the other. Each row represents a different strike.
Start by finding the strike price that’s closest to where Nifty is currently trading—this is your at-the-money (ATM) strike. From there, strikes above and below it are grouped as in-the-money or out-of-the-money, depending on whether you’re looking at calls or puts.
Open interest and change in OI
Open interest (OI) is the number of option contracts that are still open at a given strike. It is useful to see where the concentrations of open positions are.
Change in OI tracks how many open contracts were added or closed during a specific timeframe. A rising number means traders are building up new positions, while a drop can mean the positions are closing.
The OI of calls and puts is assessed by traders to identify possible resistance and support zones. A strike with high call OI may become an important resistance area, while a strike with high put OI may become an important support area.
Check volume before interpreting OI
Open interest and volume are measuring different things and OI is the number of contracts outstanding. Volume is the number of contracts traded in a given period of time.
A strike could have high OI due to accumulation of positions at an earlier time, but its current trading volume may be low. Another strike can have relatively high volume as traders are actively opening and closing positions.
Look at implied volatility (IV)
Implied volatility reflects the market‘s expected volatility over an option’s remaining life, as implied by its premium. It does not indicate whether Nifty will move up or down.
For example, suppose Nifty remains relatively stable, but the premium of a call option increases. A rise in IV could be one reason behind that change.
Before buying an option, check its IV rather than judging the premium in isolation. A fall in IV can reduce an option’s value even when Nifty moves in the expected direction.
Use the put-call ratio carefully
The put-call ratio (PCR) compares put activity with call activity. It is commonly calculated using put open interest divided by call open interest, although traders may also calculate it using trading volume. Traders can use the data available in the NSE option chain to compare put and call positioning and calculate the PCR for a selected expiry.
Some traders use PCR to understand the balance between put and call positioning. A higher reading may indicate relatively greater put activity, while a lower reading may reflect greater call activity.
Read the numbers together
Let’s take a scenario where Nifty is around 25,000. You see a lot of call OI at 25200 and put OI at 24800. Maybe worth keeping an eye on these strikes.
Now check whether OI is increasing or decreasing, whether trading volume is picking up and how IV is changing. If call OI starts declining at 25,200, for instance, traders may be reducing existing positions there. This changes the picture, but does not confirm that Nifty will cross that level.
Conclusion
The Nifty option chain provides much more information than just the highest call or put OI. Strike prices act as reference points while OI shows outstanding positions, volume shows trading activity, and IV gives expected volatility for that specific strike price.
Use these numbers with the price action of Nifty and your trading time frame. There is no one option chain indicator that will tell you where the market is going with any certainty, but knowing how these numbers work can help you evaluate an options trade more carefully.

Author: Kossi Adzo
Kossi Adzo is the editor and author of Startup.info. He is software engineer. Innovation, Businesses and companies are his passion. He filled several patents in IT & Communication technologies. He manages the technical operations at Startup.info.